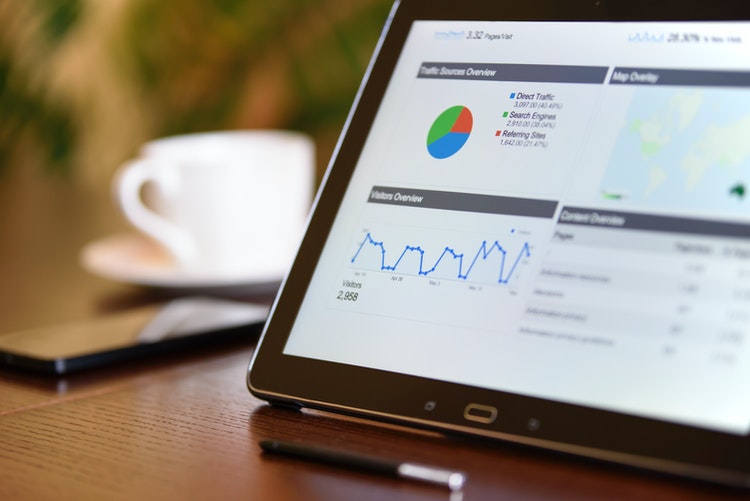
Data with incomplete information, statistics, or corrective support loses its integrity and value. Meaning it will be useless; hence data analysis is essential to ensure the safety and authenticity. Most companies have a massive amount of data (big data), which needs to be analyzed to make it useful.
What do you mean by Data Analysis?
As ordinary people, we love to keep ourselves updated with the on-going trends in business, fashion, food, and whatnot. Similarly, being a businessman or a professional, one has to keep themselves up-to-date with the data analysis trends.
Data analysis involves breaking the vast amount of data into pieces and then inspecting each part for correct information and modelling statistical data, which leads to better content, informative conclusions, and improved decision-making.
To analyze the data, one should first learn all the data handling techniques. (you should be able to store or safely dispose of the data properly)
Data Handling Techniques
Every data is highly sensitive and secretive for its owner, either public or private handling the information rightly is essential.
Enlisted are a few data handling techniques;
Manual Data Handling:
- Files
- Paper pads
- Journals
- Notebooks
Electronic Data Handling:
- Computers
- Mobile phones
- DVDs
- CDs
- USBs
As the data analysis trends keep changing, it is crucial to learn all the tips and tricks to safeguard your data. Hiring professionals is necessary to execute the techniques efficiently. Individuals can boost their profile’s worth by getting an analytics degree online and land on a dream job right away.
Data Analysis Trends
With every passing minute, numerous tech advancements get witnessed around the globe; since human needs machines are the best ones. Time is money in the world of business, hence making the best use of analytic data methods; one may save a tremendous amount of time.
There are many analytic methods, but if you know the basics, you are good to go.
Augmented Analytics: It is by far the most popular trend in 2020. It merges data analysis with learning algorithms and natural language processing (NLP). We are living in an era that is data-versed.
Augmented analytics is a backbone structure to the business intelligence required for supporting the industry. It includes the latest trends, generates revenue, focuses, and forecast on the upcoming periods.
“As per estimation, augmented analytics might reach up to $11-$13 billion by 2023 and up to $45 billion by 2017.”
Data Management: Augmented data management involves the usage of artificial intelligence (AI) and machine learning (ML) to optimize data. It affects data quality leading to better decision making and cost-effective methods.
Artificial intelligence involves making predictions based on data insights and patterns. AI is the science of making machines smarter, as quoted by Hassabis. Machine learning (ML) is the tool that assists AI in extracting information from extensive data, analyzing it, and then forecasting it. ML and AI can improve themselves, using the old and new data to depict the predictions.
Data Analytics Tools
There are two kinds of analytic tools; predictive and prescriptive.
Predictive data means estimating and forecasting future data by using past data by using mathematical models.
Prescriptive data is more toward specific intended goals, examining the data and its impacts on future decision making.
Graphs:
Data analysis gets easier when visually presented in the form of statistical data. It uses points (nodes) and edges (relationship). Graph analysis can get combined with artificial intelligence and machine learning for better quality results data analysis.
There are four basic types of graph analysis:
- Comparison graphs (bars and line charts)
- Composition graphs (stacked area charts)
- Distribution graphs (line histograms)
- Relationship graphs (scatter plots and bubble charts)
Data optimization:
It includes the use of cloud computing in business intelligence. Everyone is familiar with Google’s Gmail, that is one example of cloud computing; it involves storing, retrieving data over software or hardware available through a network.
Cloud Computing can be private or public, depending on the type of data available on it. Hence, cloud computing makes data analysis much more manageable and the business smarter.
Conversational Analytics:
It involves National Language Processing (NLP) by which asking questions regarding data, and receiving detailed answers/information is made easy. Conversations can occur anywhere; hence the technology has been improvised to catch and comprehend the data from them.
Data Automation:
Analysis of Data automatically can help save time and boost business. All the data gets updated automatically (data automation), pre-existing is evaluated and compared with the new data, and better data patterns appear from prediction.
Automation helps both the employers and employees to move through a project efficiently and smoothly.
Collaborative Business Intelligence:
It merges business intelligence with social media and web technology (2.0).
Collaborative BI increases customer satisfaction with faster and informative decision making. The organization’s raw data is analyzed and updated using applications and software, having a significant impact on quality.
Mobile Business Intelligence:
You can access the world by the magical device in your hands. Mobile BI makes it easy to access the all-time business-related data on the phone, just a click away!
Confidential or not, AI or non-AI; everything is now available on software that one may access through the internet. Some need authorized permissions and payments, while others are just free for everyone!
Trends are never constant, learning, and knowing all the possible ways of data analysis is the only possible key to survival in this competitive, ever-changing era of technology!
Also, Read Artificial Intelligence in Data Analytics


